Next: Single, double and triple... Up:The electron density as a support... Previous: The electron density as a support...


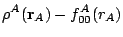
and the molecular deformation which is the sum of all the atomic deformations:


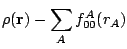
This latter quantity has some similarity with the so-called charge density difference functions, which are the differences between the molecular density and the densities of the isolated atoms, placed in the corresponding sites of the molecule and taken in suitable valence states.
Note, however, that the spherical terms subtracted in eq(2) are obtained from the very molecular density,
without any intervention of reference atoms. In practice, these two
quantities exhibit some resemblance, but this is because, as it will be
shown in the following section, the spherical terms of the atoms in our
representation of the molecular density are similar to those of the
isolated atoms.
For
convention, in pictures positive
density deformations (charge accumulations) will be drawn in red, and negative deformations (charge
depletion), in blue. Both types
of deformations for a given absolute contour value will be drawn
together in a single picture, except in those cases in which a
separation of positive and negative deformations in diferent figures is
necessary for clarity. Different absolute contour values will be drawn
in different pictures. The next pictures illustrate these conventions in
case of water for contour values of ±0.05 au
(electron / bohr3).


