

Next: 8.1.10 Biphenyl anion radical
Up: 8.1 Radicals containing r
Previous: 8.1.8 Isopropyl neutral radical
Contents
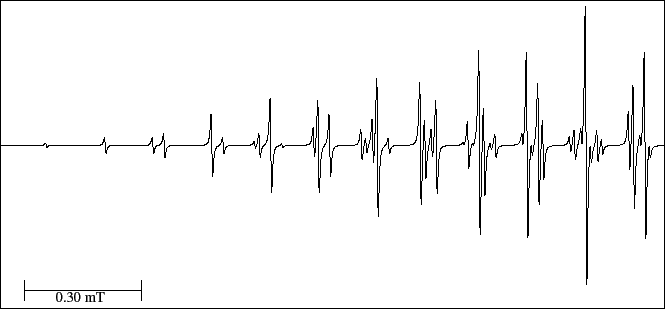
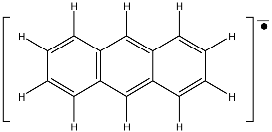
The anthracene anion is a case relatively complex with several experimental lines (75).
In Fig. 24 only the left part of the spectrum is represented .
The most intense line marks the centre of the spectrum and
the less intense line (left side) can be hardly detected.
The sum of the relative intensities of the lines is  ;
this gives a relation of intensities between the central and the first line of 72:1.
Consider the following points for the interpretation:
- The two first hyperfine splittings are obtained applying the interpretation rules (section 7, point 6).
- The third hyperfine splitting is calculated applying the Eq. (8),
where L is measured directly in the experimental spectrum keeping in mind that only half of it
has been represented and that its centre is the line 38 (the most intense one).
- Load the EPR simulator and note down the range of the experimental spectrum.
- Obtain the hyperfine splittings, fill the table in the EPR simulator,
and reload the spectrum.
- Compare both spectra (experimental and simulated), use the range annotated previously
and measure carefully the DHpp value (although the interpretation of spectrum is correct the
number of lines may not coincide).
- Overlap both spectra and refine the values of the hyperfine splitting and/or DHpp
to get a better agreement.
- Print out the results.
Figure 24:
EPR spectrum of the anthracene anion radical.
 |
[Exercise]
- Interpret correctly the spectrum.
- Use different values for the parameter DHpp
and observe its effect on the simulated spectrum.
- Fill out
- Say which simulation resembles more to the experimental spectrum.
- Print out only that simulated spectrum.


Next: 8.1.10 Biphenyl anion radical
Up: 8.1 Radicals containing r
Previous: 8.1.8 Isopropyl neutral radical
Contents
Universidad Autónoma de Madrid, Departamento de Química Física Aplicada

