Maximum number of lines (Eq. (9)):
N = (2![]() 2
2![]() 1/2 + 1)
1/2 + 1)![]() (2
(2![]() 4
4![]() 1/2) = 3
1/2) = 3![]() 5 = 15 lines.
5 = 15 lines.
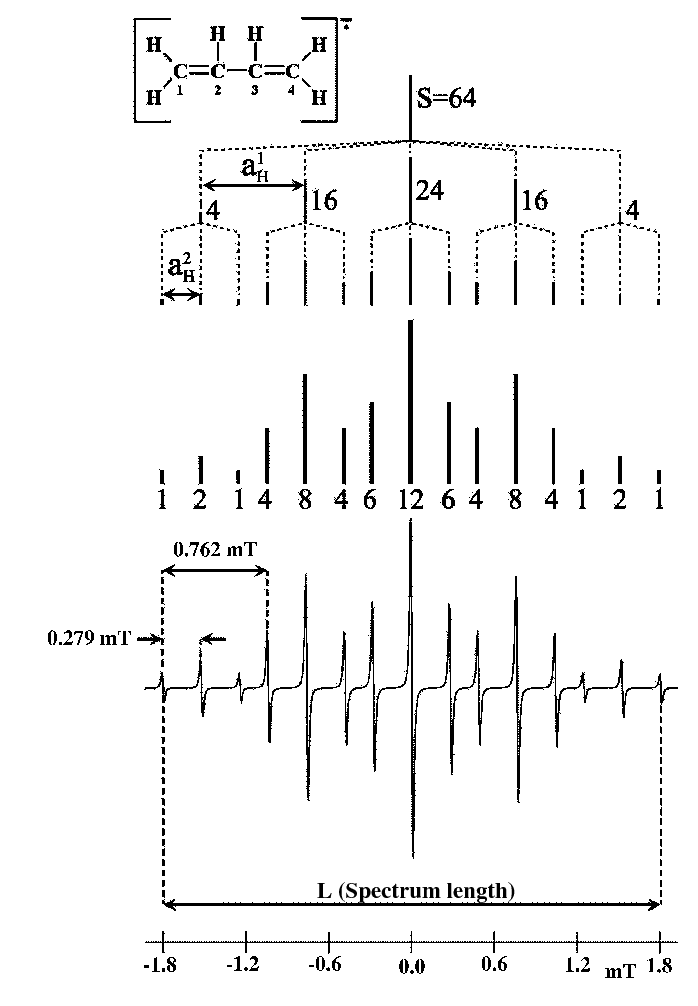
Hyperfine splittings:
![]() =
= ![]() = 0.279 mT (triplet, 1:2:1). Between 1
= 0.279 mT (triplet, 1:2:1). Between 1![]() and 2
and 2![]() line.
line.
![]() =
= ![]() = 0.762 mT (quintet, 1:4:6:4:1). Between 1
= 0.762 mT (quintet, 1:4:6:4:1). Between 1![]() and 4
and 4![]() line.
line.
Length of the spectrum (Eq. (8)):
L = 2![]() 2
2![]() 1/2
1/2![]() + 2
+ 2![]() 4
4![]() 1/2
1/2![]() = 2
= 2 ![]() 0.279 + 4
0.279 + 4 ![]() 0.762
= 3.606 mT.
0.762
= 3.606 mT.
The value measured on the spectrum (from the centre of the first line to the centre of the last one)
should coincide with that calculated if it is properly interpreted.
In the EPR simulator, the horizontal distance (in mT) between two mouse clicks is given in a small window on the left side. This allows you to measure the hyperfine splittings directly on the screen. Compare your measures for the hyperfine splittings (done with the mouse) with those values given above.
Apply the Eq. (8) to calculate the length of the spectrum (L) and measure it on the spectrum.
Reconstruction of the spectrum. It is shown in the upper part of the Fig. 16. The numbers over the lines represent the relative intensities or degenerations (heights).
This radical and others that we will see below are presented like resolved examples. Try to understand them. Although they are already resolved, load the simulator and introduce the data corresponding to the spectra to obtain a correct the simulation.