Next: 2 Objectives
Up: 1 Beginning
Previous: 1 Beginning
Contents
There are two ways to load the EPR simulator:
- From the tutorial.
In all the examples of the tutorial there is a link, ''simulator'',
pressing on it we load other window with the EPR simulator.
In this case, the simulator loads the experimental spectrum that we are studying
(that from the one we press the link ''simulator'')
and we do not have the option of choosing another spectrum.
Once you have successfully simulated the spectrum, close this window to continue with the tutorial.
- From the initial menu (http://joule.qfa.uam.es/epr or http://rmn10.qfa.uam.es/epr).
Press in ''Teaching'' and chose ''Simulator v 2.0''.
Then, select the experimental spectrum that we want to simulate in ''Spectrum''
(series c001, c002, c003,
 ).
Then click ''go''.
).
Then click ''go''.
The spectra included in the tutorial differ from those that we can load entering directly in the simulator
through the initial menu.
So we must choose the correct way to go.
Regardless of how you load the simulator, its utilisation, that we describe briefly below, is similar.
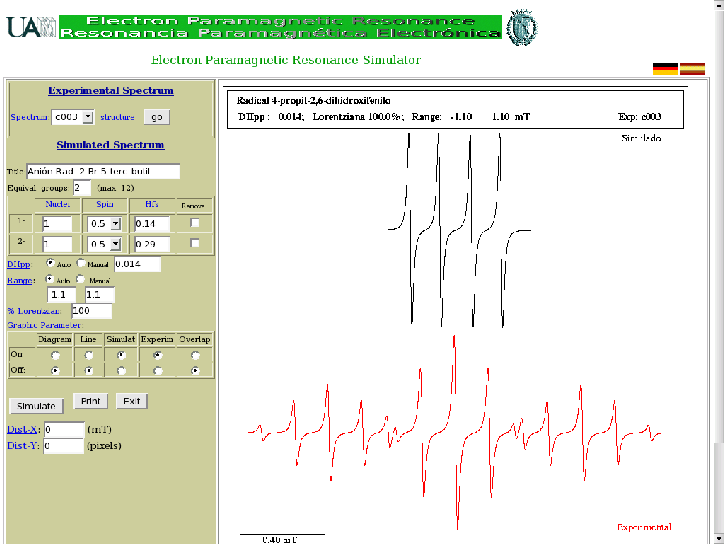
In the simulator, we have to change the magnetic and/or graphics parameters
to obtain a theoretical or simulated spectrum (draw in black) similar to the experimental (draw in red):
- We start by knowing the structure of the molecule by clicking on ''structure''.
The name of the radical that appears in the structure window must match the one that appears on the right part
of the simulator when it is ''on'' the option ''Exp'' in the graphic parameters (see below).
Returning to the structure, we have to identify the nuclei that have non-zero spin.
We also have to pay attention to the chemical environment of each nucleus to predict which are equivalent
(see below).
- The box ''Name:'' can be changed and its content will appear in the first page of
the impression along with the results.
- Put the number of equivalent groups ''Equiv. groups:'' or number of different hyperfine couplings
of the radical (1, 2, 3, ).
Then we press the intro key (or click button Reload) to load this value and we will see that in the
following table the correct number of rows appears.
Equivalent nuclei are the ones that have the same chemical environment and therefore their behaviour
or coupling with the electronic spin is identical (they will have the same hyperfine coupling constant).
For example, the isopropyl radical
 has two sets of equivalent protons
one with six protons pertaining to the methyls
has two sets of equivalent protons
one with six protons pertaining to the methyls  and another group with only one proton that of the
  .
This molecule will have, in principle, two different hyperfine couplings.
.
This molecule will have, in principle, two different hyperfine couplings.
- Fill out the Table that appears below, that has the following four columns:
- Nuclei
- refers to the number of equivalent nuclei of a particular group and, therefore,
they have the same hyperfine constant.
- Spin
- represents the spin of the nuclei seen in the previous column (see Table 1).
- Hfs
- is the value of the hyperfine constant in mT (militesla).
The value of the hyperfine constant can be measured directly in the experimental spectrum by
clicking twice with the mouse.
To see the experimental spectrum you have to select the option '' Exp.'' in the graphic parameters
(see below).
- Remove
- checking this column the entire row will be eliminated.
Once the table is filled, press ''Reload'' or just hit return to simulate your spectrum.
- Change, if necessary, (passing to ''Manual'') the peak to peak linewidth DHpp
and the range of the spectrum.
- We also can modify the following graphic parameters:
- Diagram
- According to the values introduced in the table the tree of successive splittings
(splitting tree diagram)
that produce the nuclear spins will be represented.
- Line
- Simulates the spectrum in the shape of lines.
- Simulat
- To view the simulated spectrum.
- Experim
- To see the experimental spectrum.
- Overlap
- Overlap the simulated and the experimental spectra.
Use this option only when the simulated and experimental spectra are close enough.
- Finally, print out or save to your recording system the results that appear on the screen by pressing ''Print''.
Choose always the option ''pdf''.
The simulator has its own help.
Pressing the shadowed words in the left side of the simulator a window is opened which provide information.
For example, pressing on the word ''Spin'' a window with information and with a table of the main nuclear spin
is displayed.
[I] When an exercise is asked to be delivered, you should print out the
simulated and the experimental spectra without overlap and add also the splitting tree diagram.
Next: 2 Objectives
Up: 1 Beginning
Previous: 1 Beginning
Contents
Universidad Autónoma de Madrid, Departamento de Química Física Aplicada